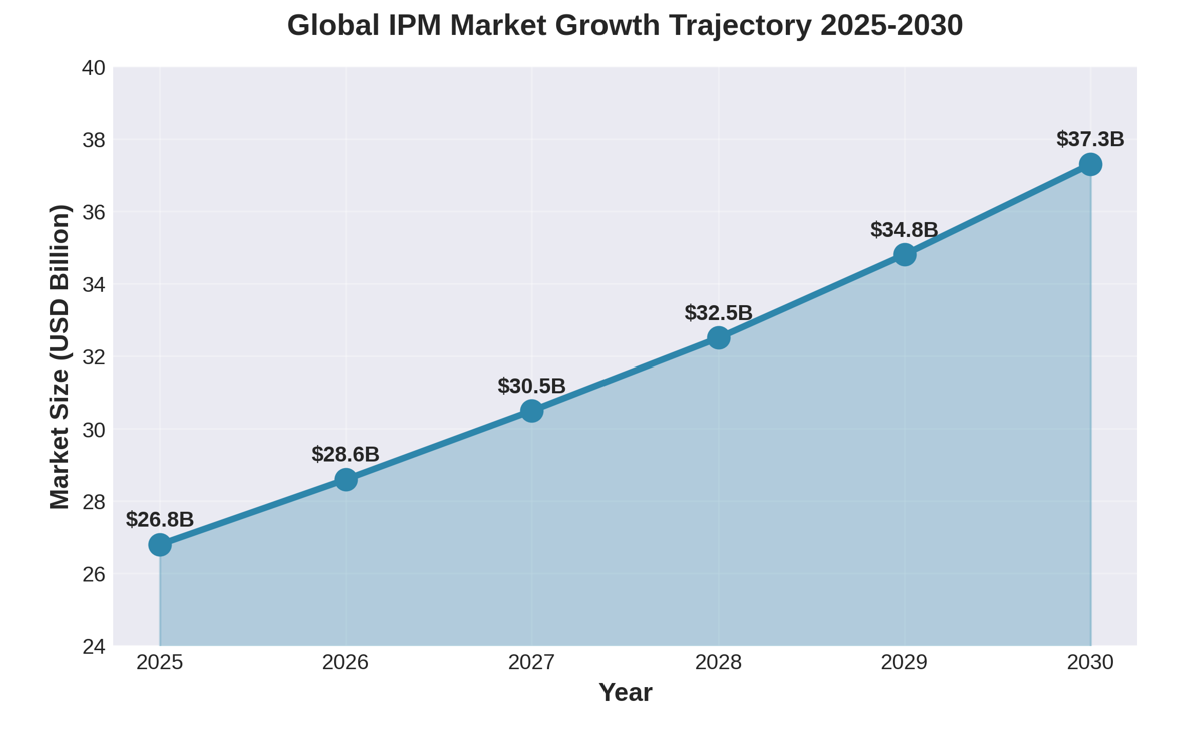
The global Integrated Pest Management market reached $26.8 billion in 2025 and is projected to grow to $37.3 billion by 2030, representing a compound annual growth rate of 6.85%. This expansion reflects agriculture's accelerating shift toward combining biological, chemical, and cultural methods to reduce pest damage while minimizing environmental impact.
Market Growth Trajectory
The steady upward trajectory from $26.8 billion to $37.3 billion represents more than mere market expansion—it signals a fundamental transformation in agricultural pest management philosophy. Figure 1 illustrates this consistent growth pattern, with the market expected to add approximately $10.5 billion in value over the five-year period.
Economic Pressures Drive Adoption
The Food and Agriculture Organization estimates that up to 40% of global crop production is lost annually to pests and diseases, costing the global economy over $220 billion, with invasive insects adding at least $70 billion in damages. These staggering economic impacts demonstrate why effective pest management remains a critical priority for global food security.
These losses underscore the urgent need for effective pest management strategies that can protect crops while minimizing environmental harm and production costs.
Regional Growth Patterns
Asia-Pacific leads market expansion with a projected 7.5% CAGR through 2030, capturing 47.9% of global market share in 2024. The regional breakdown (Figure 2) reveals the concentration of IPM adoption, with the Asia-Pacific region's dominance stemming from:
Intensive agricultural production systems
Government subsidies supporting sustainable farming practices
Rapid adoption of precision agriculture technologies
Growing middle-class demand for safer food products
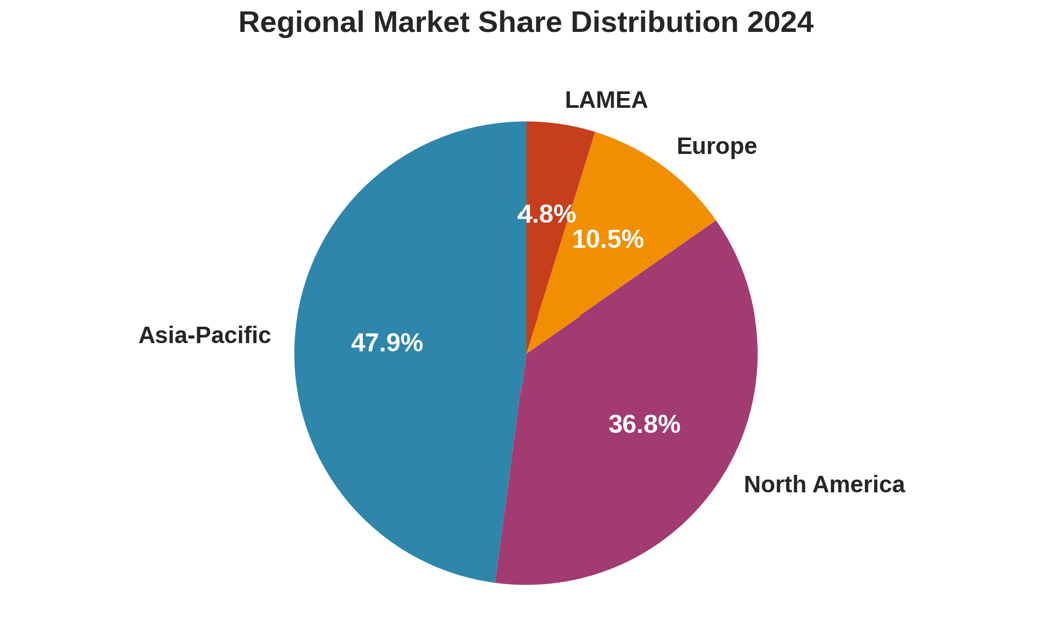
North America maintains significant market presence with a 36.8% share in 2024, driven by regulatory support and established infrastructure. The U.S. Environmental Protection Agency has registered 390 biopesticide active ingredients as of 2020, with continued additions of new microbial and biochemical actives through 2025.
Europe accounts for 10.5% of the global market, while Latin America, Middle East, and Africa (LAMEA) collectively represent 4.8%. Asia-Pacific's 7.5% CAGR significantly outpaces the global average of 6.85%.
Enroll in the Crop Production Course
Application Sectors Driving Demand
Agriculture dominates IPM applications with a commanding 67.2% market share, as illustrated in Figure 3. This overwhelming presence highlights how crop protection remains the primary driver of IPM adoption. Farmers face constant pressure to balance productivity with sustainability, and IPM provides the optimal combination of chemical, biological, and cultural controls to protect harvests while reducing over-reliance on synthetic pesticides.
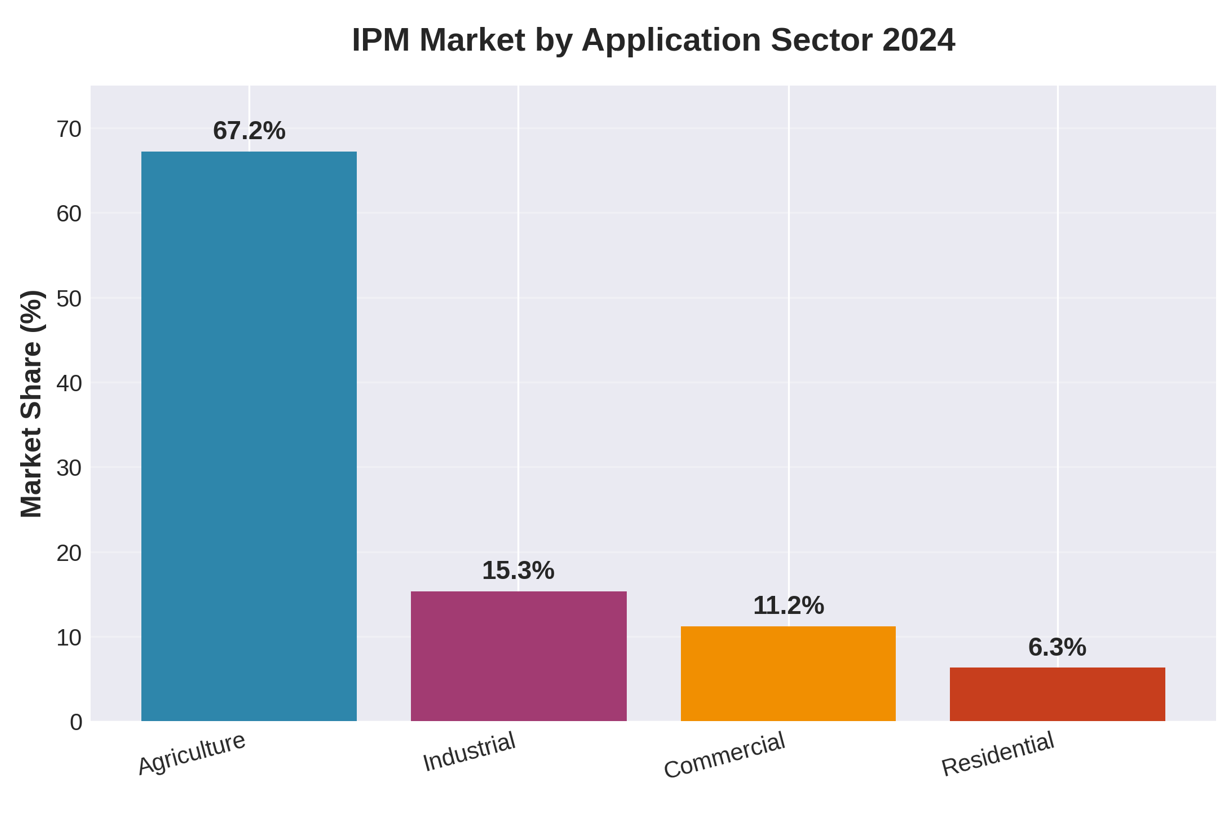
Market Distribution by Application Sector:
Agriculture: 67.2%
Industrial applications: 15.3%
Commercial buildings: 11.2%
Residential sector: 6.3%
Control Methods and Market Segmentation
Figure 4 reveals the distribution of control methods within the IPM market. Chemical control maintains the largest segment at 38.6% of the market, reflecting the continued reliance on conventional pesticides within integrated frameworks. However, the biological control segment is experiencing the fastest growth at 7.2% annually, indicating a clear shift toward more sustainable alternatives.
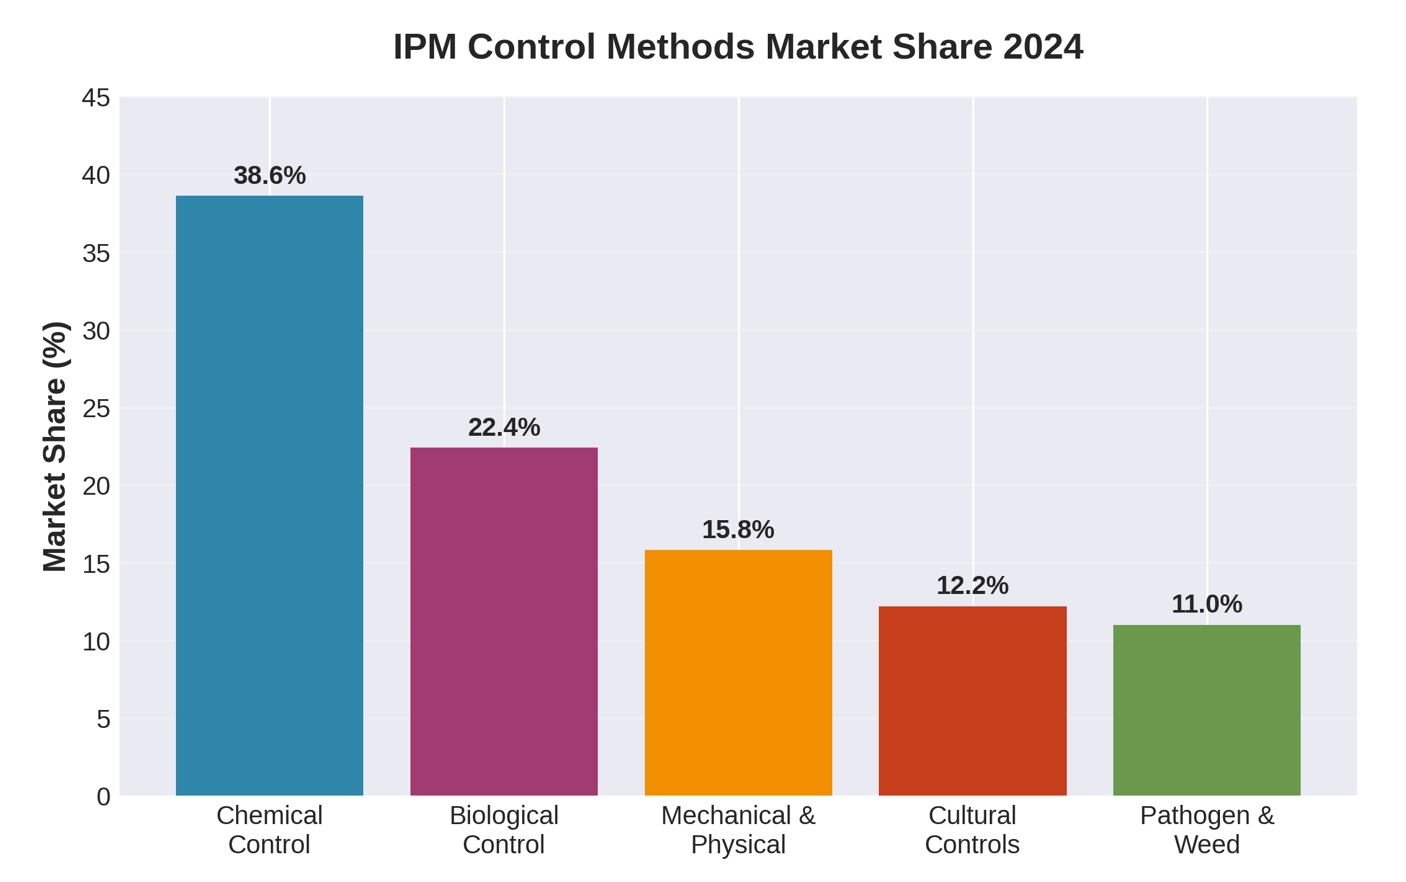
The control method breakdown shows:
Chemical Control: 38.6% - Remains dominant for immediate, large-scale pest suppression
Biological Control: 22.4% - Growing fastest as farmers adopt natural predators and beneficial organisms
Mechanical & Physical: 15.8% - Includes traps, barriers, and mechanical removal
Cultural Controls: 12.2% - Crop rotation, sanitation, and habitat modification
Pathogen & Weed: 11.0% - Specialized approaches for disease and weed management
Biopesticides Gain Ground
The biopesticides segment is expanding rapidly, projected to grow from $6.72 billion in 2025 to $11.41 billion by 2030 at an 11.19% CAGR. This growth rate is 2.5 times faster than traditional chemical pesticides, as shown in Figure 5), which directly compares the growth trajectories of these two approaches.
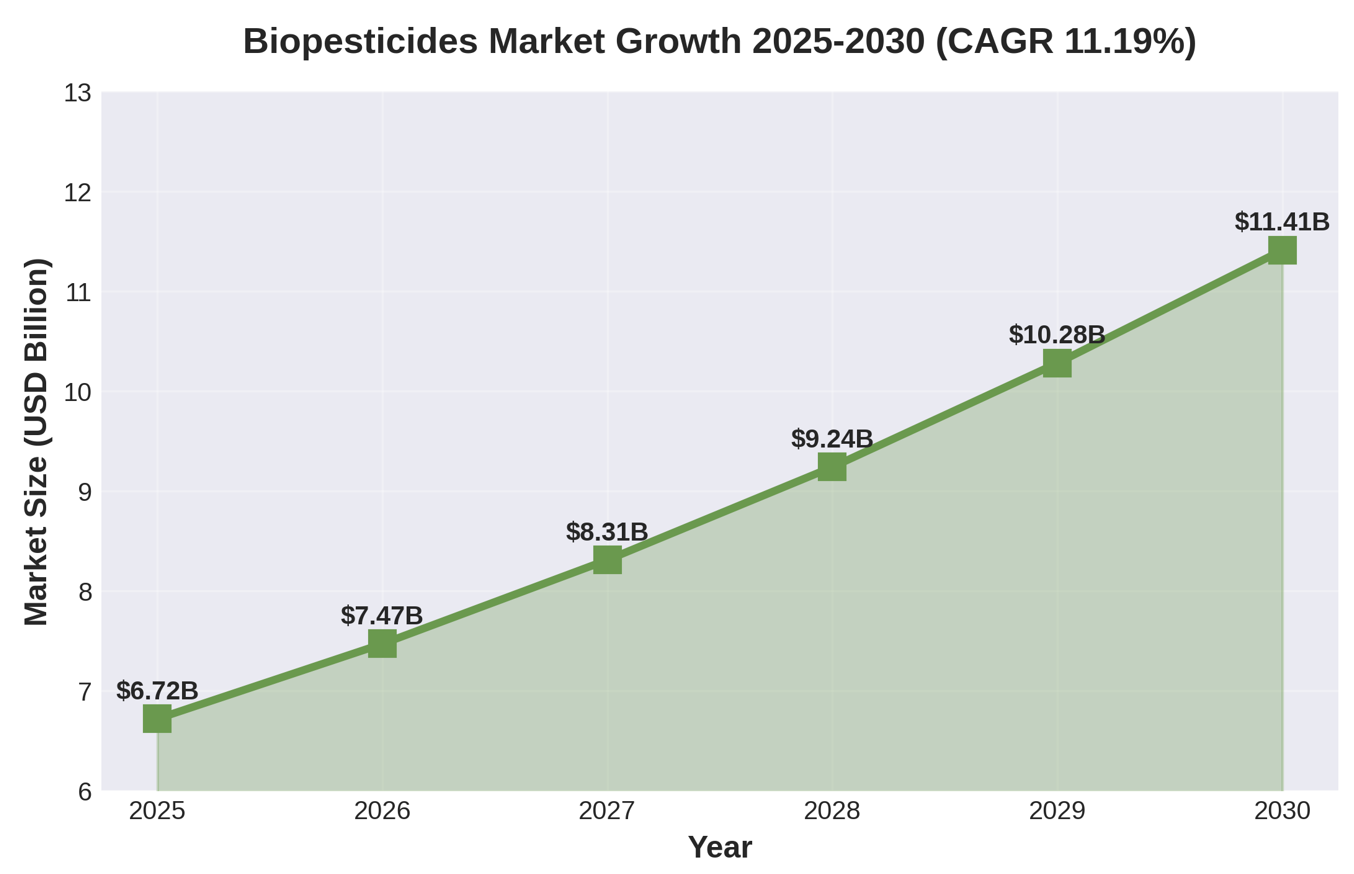
Recent research indicates that biopesticides could match the chemical pesticide market in size by 2040, with annual growth rates of 10-20% compared to single digits for conventional chemicals. This accelerated adoption reflects:
Improved efficacy through advanced microbial formulations (Bacillus, Beauveria bassiana, Trichoderma strains)
Enhanced stability and shelf-life through nanotechnology and bioencapsulation
Growing regulatory restrictions on synthetic pesticides
Consumer demand for chemical-free food products
Better compatibility with Integrated Pest Management systems
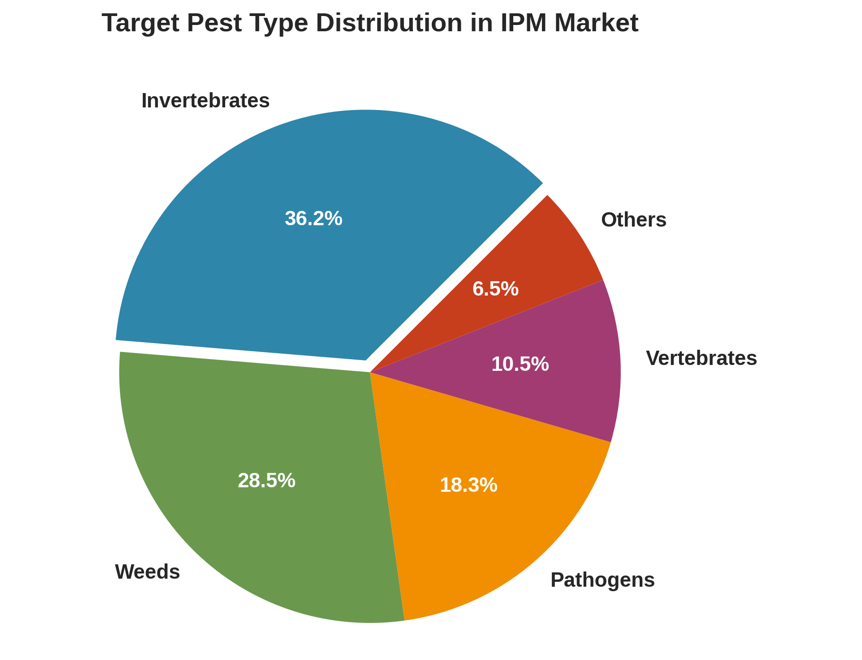
Target Pest Types and Market Focus
Figure 6 breaks down the IPM market by target pest types. Invertebrates lead with 36.2% of market focus, followed by weeds at 28.5%, pathogens at 18.3%, vertebrates at 10.5%, and other pests at 6.5%. This distribution reflects the relative economic impact and prevalence of different pest categories across global agriculture.
Technology Integration Transforms IPM
Digital tools, including AI-powered monitoring systems, precision agriculture platforms, and data-driven decision support, are revolutionizing IPM implementation. Figure 7 illustrates current technology adoption rates in modern IPM:
Precision Agriculture: 25%
IoT Sensors: 22%
Data Analytics: 20%
AI & Machine Learning Platforms: 18%
Traditional Methods Only: 15%
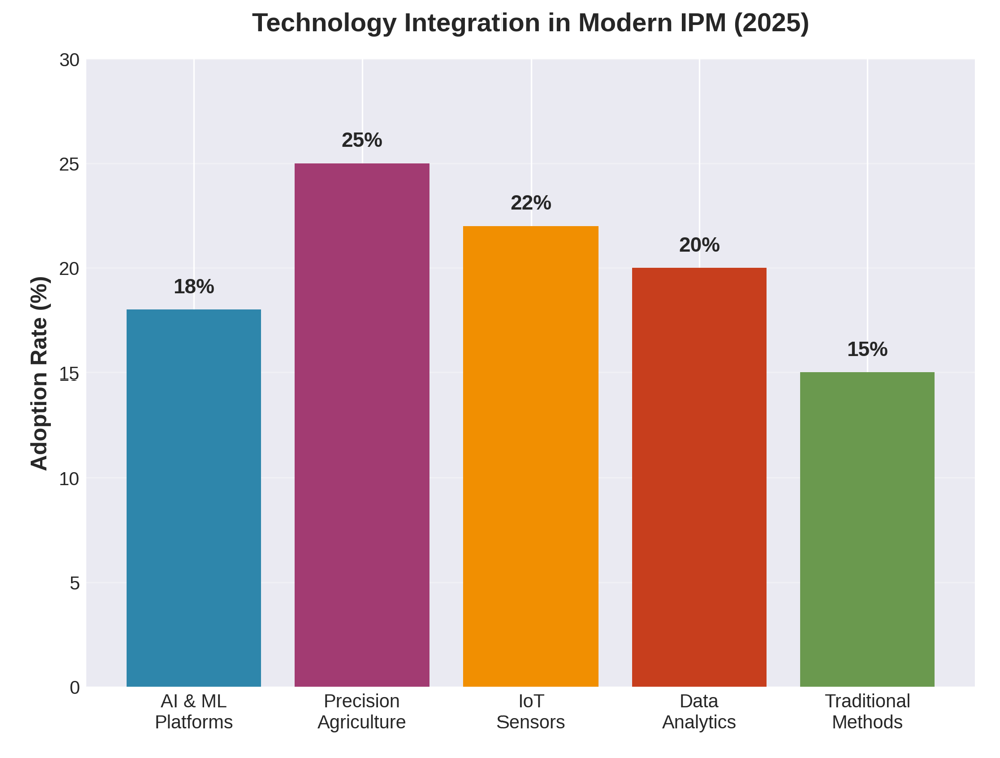
These technologies enable real-time pest detection, accurate forecasting, and targeted interventions that reduce blanket pesticide applications while improving outcomes.
Regulatory Pressure Accelerates Change
The European Union's tightened maximum residue limits in May 2025 for compounds including thiacloprid and acetamiprid have forced exporters worldwide to adopt integrated approaches. Similar regulatory shifts in California and other jurisdictions are driving farmers toward multi-tactic programs that blend biological agents with reduced-risk chemistries and data analytics.
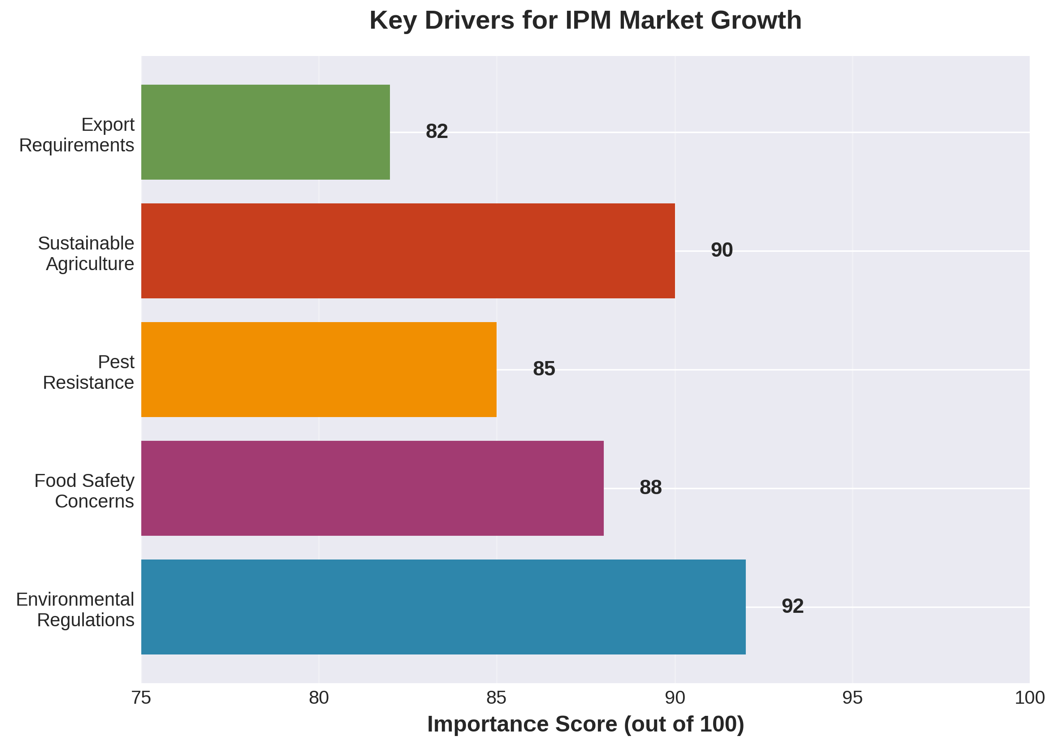
Key Drivers Propelling IPM Market Growth
Environmental Regulations: 92% - Stringent government policies restricting synthetic pesticide use
Sustainable Agriculture: 90% - Growing commitment to regenerative farming practices
Food Safety Concerns: 88% - Consumer demand for residue-free produce
Pest Resistance: 85% - Rising resistance to conventional pesticides
Export Requirements: 82% - International trade standards favoring IPM practices
Market Evolution and Future Trajectory
Figure 10 projects the long-term shift from traditional pesticide-only approaches to integrated pest management. The crossing point—where IPM adoption equals traditional methods at approximately 50% each—is projected for 2030. This represents a pivotal moment in agricultural pest management.
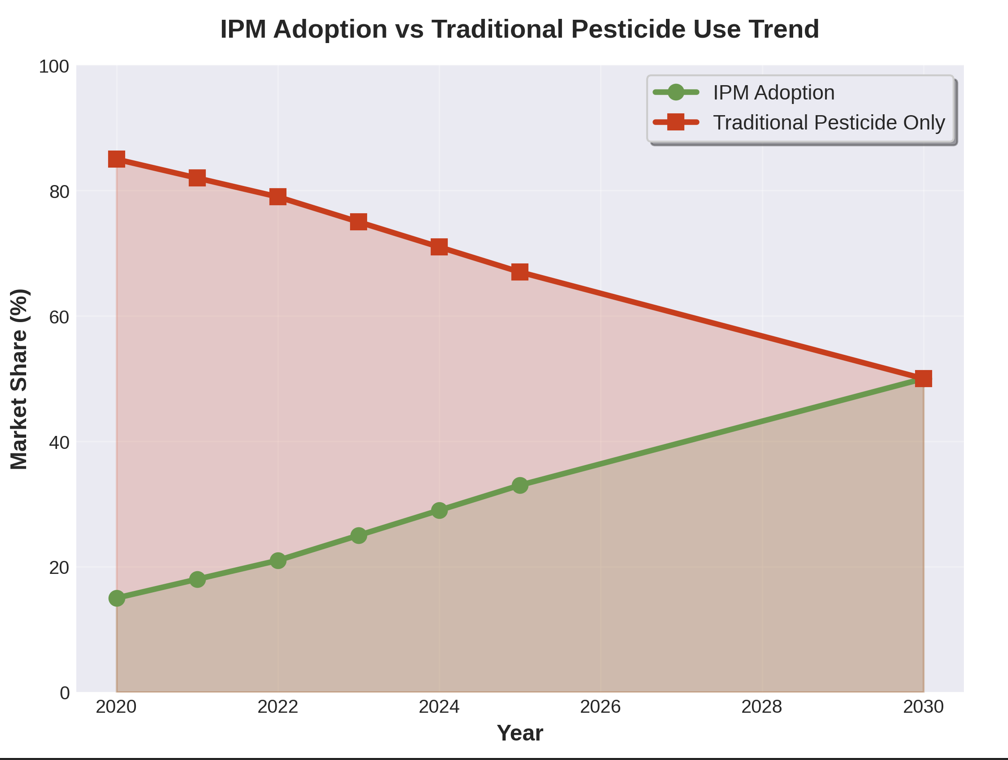
By 2030, IPM adoption is expected to reach 50% of the market, up from 33% in 2025. This rapid transition reflects:
Increasing pest resistance making traditional approaches less effective
Growing profitability of sustainable farming methods
Enhanced farmer education through extension services and field schools
Improved access to biological control products and services
Implementation Challenges Persist
Despite promising growth trajectories, IPM adoption faces barriers in developing regions, including:
Fragmented landholdings limiting economies of scale
Limited access to technical training and extension services
Higher initial implementation costs compared to conventional methods
Inconsistent product performance in varying environmental conditions
Insufficient infrastructure for biological control product distribution
The FAO has trained approximately 10 million farmers on IPM procedures through Farmer Field Schools across 95 countries, yet consistent application remains challenging without proper incentive structures, market premiums for IPM-certified products, and ongoing technical support.
Investment and Innovation
Public and private sector investment continues accelerating IPM development. The USDA-NIFA invested $19.6 million in 2023 under the Crop Protection and Pest Management program to develop and extend new IPM tactics. Separately, USDA-APHIS provides up to $63 million annually for plant pest and disease management projects.
Private sector investment in biopesticide research and development reached $3.7 billion in recent years, validating commercial momentum for digital and biological technologies. Major agricultural companies are establishing strategic partnerships to develop advanced formulations and delivery systems.
Outlook: A Sustainable Future
The shift toward IPM represents not just market growth but a fundamental transformation in how agriculture approaches pest management—moving from reactive chemical applications toward proactive, ecosystem-based strategies that protect both crops and environmental health.
The convergence of regulatory pressure, technological advancement, consumer demand, and environmental necessity positions the IPM market for sustained growth beyond 2030. As biological control methods improve in efficacy and consistency, and as digital tools make IPM implementation more practical for farmers of all scales, the integration of diverse pest management tactics will become standard practice rather than an alternative approach.
The data clearly indicates that integrated pest management is transitioning from niche practice to mainstream agriculture, driven by economic necessity, regulatory requirements, and the fundamental need to protect global food security while preserving ecosystem health for future generations.
Data Sources and Methodology
Market data compiled from peer-reviewed research, industry reports, and official FAO publications. All monetary values in USD. Growth projections are based on compound annual growth rates calculated from verified 2024-2025 baseline data. Charts generated using verified market intelligence from multiple independent sources, including Mordor Intelligence, Market Research Future, and FAO statistical databases.