Whether you farm half a hectare in Kenya or 500 hectares in Brazil, understanding your cost of production determines whether your operation survives or fails. With global fertilizer prices rising 15% in the first half of 2025 and commodity prices under pressure worldwide, calculating your true production costs has never been more critical.
Globally, farms under five hectares produce over half the world's staple crops — including more than 80% of rice and 75% of groundnuts. Yet the principles of cost calculation apply equally to a smallholder in South Asia and a commercial operation in North America. This guide covers all farm scales.
The Universal Formula
Cost of Production per Unit = Total Production Costs ÷ Units Produced
Examples:
Maize: KES 45,000/acre ÷ 30 bags = KES 1,500 per 90kg bag
Wheat: €850/hectare ÷ 6 tonnes = €142 per tonne
Rice: ₹65,000/hectare ÷ 5 tonnes = ₹13,000 per tonne
The challenge lies in capturing all costs—visible and hidden. Many farmers underestimate their true costs by overlooking family labor, land opportunity cost, or equipment depreciation.
Cost Components by Farm Scale
Production costs vary dramatically by farm size, region, and farming system. The FAO defines smallholders as farms managing less than 10 hectares, though most operate on under 2 hectares. Here's how costs typically break down across different scales:
Cost Structure by Farm Scale (% of Total Production Costs)
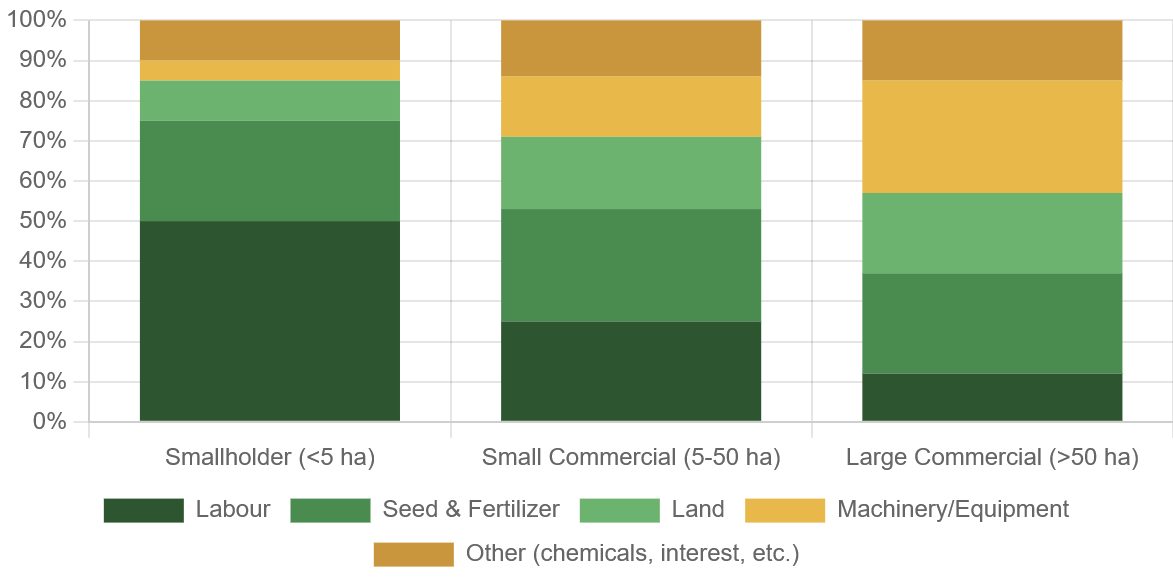
Smallholder Farms (<5 hectares)
Labor dominates costs — often 40-60% of total expenses—because most work is done by family members. Seed and fertilizer represent the main cash outlays. Many smallholders use saved seed and organic inputs, reducing cash costs but potentially limiting yields. The key challenge is accessing quality inputs at affordable prices when needed.
Small-Scale Commercial Farms (5-50 hectares)
These operations balance hired and family labor while investing more in purchased inputs. Mechanization costs rise as farmers rent or purchase equipment. Land costs—whether rent or the opportunity cost of owned land—become significant. Access to credit for seasonal inputs often determines profitability.
Large-Scale Commercial Farms (>50 hectares)
Capital intensity increases dramatically. Machinery, equipment depreciation, and interest on borrowed capital can exceed 25% of costs. Fertilizer and crop protection remain substantial, but economies of scale reduce per-hectare expenses for inputs purchased in bulk.
The Global Input Cost Picture
Input costs in 2025 remain elevated across all regions. According to the World Bank's latest outlook, fertilizer prices are expected to rise 7% over 2025 before stabilizing in 2026, while energy prices—critical for irrigation pumping and transport—are projected to decline 17%.
Global Fertilizer Price Index (2015-2025)
.png?alt=media&token=22a3249b-acb7-415e-a7cc-8c57889d9852)
Research published in Food Policy found that while commercial farmers globally absorbed 2021-2022 fertilizer price spikes with relatively modest demand reduction, African smallholders were hit hardest—facing both higher relative costs and fewer alternatives.
Regional reality: A 50kg bag of urea that costs $25 in a US port may cost $45-60 by the time it reaches a rural village in Sub-Saharan Africa, due to transport, handling, and distribution margins. Understanding your local delivered cost—not international prices—is essential.
Land: The Variable Giant
Land costs show the widest global variation. In the EU, average cropland rent reached €173 per hectare in 2023, ranging from €67/ha in Slovakia to €914/ha in the Netherlands. In the US Corn Belt, prime land rents for $580-680/hectare ($235-275/acre).
Agricultural Land Rental Costs by Region (2024-2025)
.png?alt=media&token=9876903c-e572-48bc-a727-52b831c4e879)
For smallholders in developing regions, formal land rental markets often don't exist. Customary arrangements, sharecropping, or informal access complicate cost calculation. Even without cash rent payments, farmers should account for the land's opportunity cost—what income it could generate in alternative use.
Calculating Your Costs: A Practical Approach
Step 1: List all cash expenses. These include purchased seed, fertilizer, crop protection chemicals, hired labor, fuel, transport, and any rental payments for land or equipment. Keep receipts or records throughout the season.
Step 2: Value unpaid inputs. Family labor should be valued at local wage rates for equivalent work. If you could earn 500 shillings daily as a farm worker, your own labor carries that cost. Owned land should be valued at local rental rates or 3-5% of market value annually.
Step 3: Include overhead costs. Depreciation on equipment (purchase price divided by useful life years), interest on any loans, insurance, and taxes are often forgotten but real.
Step 4: Calculate per-unit cost. Divide total costs by actual production. Use realistic yield estimates based on your historical averages—not best-case scenarios.
Cost Category | Smallholder Example (1 ha maize, East Africa) | Commercial Example (100 ha wheat, Europe) |
Seed | $30 | $4,500 |
Fertilizer | $80 | $18,000 |
Crop Protection | $15 | $12,000 |
Labour (paid + valued) | $120 | $8,000 |
Land (rent or opportunity) | $50 | $17,300 |
Machinery/Equipment | $25 | $22,000 |
Other (transport, interest, etc.) | $30 | $8,200 |
Total Cost | $350/ha | $90,000 ($900/ha) |
Expected Yield | 2 tonnes/ha | 6 tonnes/ha |
Breakeven Price | $175/tonne | $150/tonne |
The 2025 Margin Challenge
Globally, many farmers face break-even or negative margins in 2025. The FAO forecasts global cereal production at nearly 3 billion tonnes—up 3.8% year-on-year—which keeps prices under pressure despite strong demand.
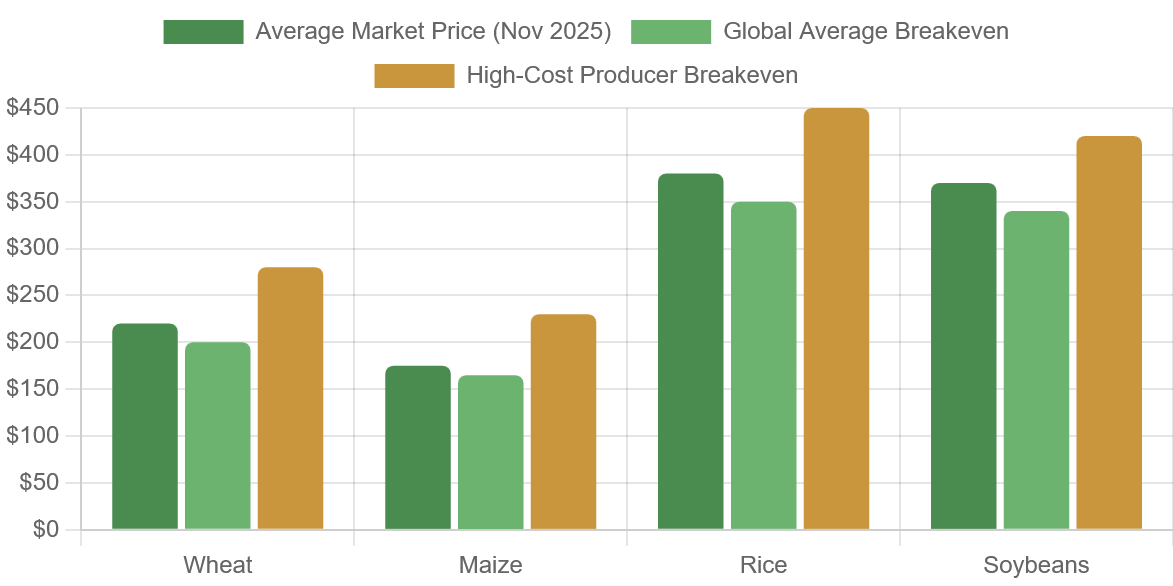
For many crops in many regions, current market prices sit at or below production costs. This squeeze affects farmers differently: large-scale operators with lower per-unit costs and access to hedging tools can survive thin margins longer, while smallholders with higher relative costs but lower cash exposure may be more resilient to price drops—provided they can meet household food needs.
Using Cost Data for Decisions
Marketing decisions: Knowing your breakeven price lets you identify when forward contracts or market prices offer genuine profit versus guaranteed loss. If your maize costs $180/tonne to produce, selling at $160 locks in a loss regardless of how the price might move later.
Enterprise choice: Compare returns across crops you could grow. A crop with lower gross revenue but also lower costs may deliver better net returns than a high-value crop with high input requirements you cannot reliably finance.
Input optimization: Cost analysis reveals where spending delivers returns and where it doesn't. Soil testing, for example, can reduce fertilizer costs 15-30% while maintaining yields by eliminating unnecessary applications.
Negotiation power: Documented production costs strengthen conversations with buyers, lenders, and landlords. Evidence-based arguments about sustainable pricing carry more weight than general claims of hardship.
Reducing Costs Without Sacrificing Yields
Across all farm scales, certain strategies consistently improve cost efficiency:
Soil testing: Applying nutrients based on actual deficiencies rather than standard recommendations can cut fertilizer costs significantly. Many farmers overapply some nutrients while underapplying others.
Seed selection: Choosing varieties suited to local conditions often outperforms premium-priced alternatives bred for different environments. Research across Southern Africa found that appropriate variety selection combined with basic irrigation management transformed scheme profitability.
Integrated pest management: Scouting fields before spraying, using biological controls where effective, and timing applications precisely can reduce crop protection costs 20-40% compared to calendar-based programs.
Group purchasing: Smallholders who aggregate input purchases through cooperatives or farmer groups typically secure 10-25% discounts on fertilizer, seed, and chemicals.
The farmers who thrive in difficult markets are those who know their numbers. Whether you track costs in a smartphone app or a paper notebook, the discipline of recording and analyzing expenses transforms farming from a gamble into a business.