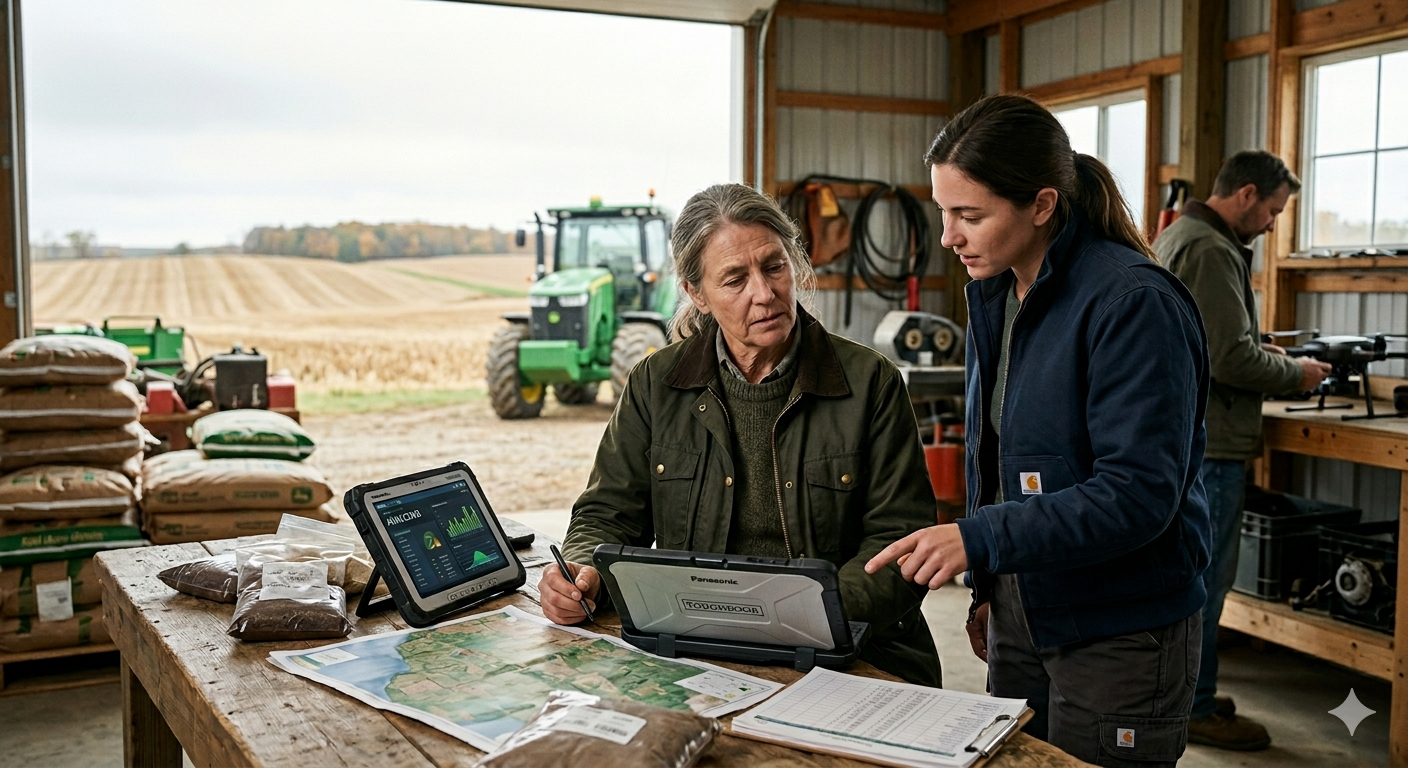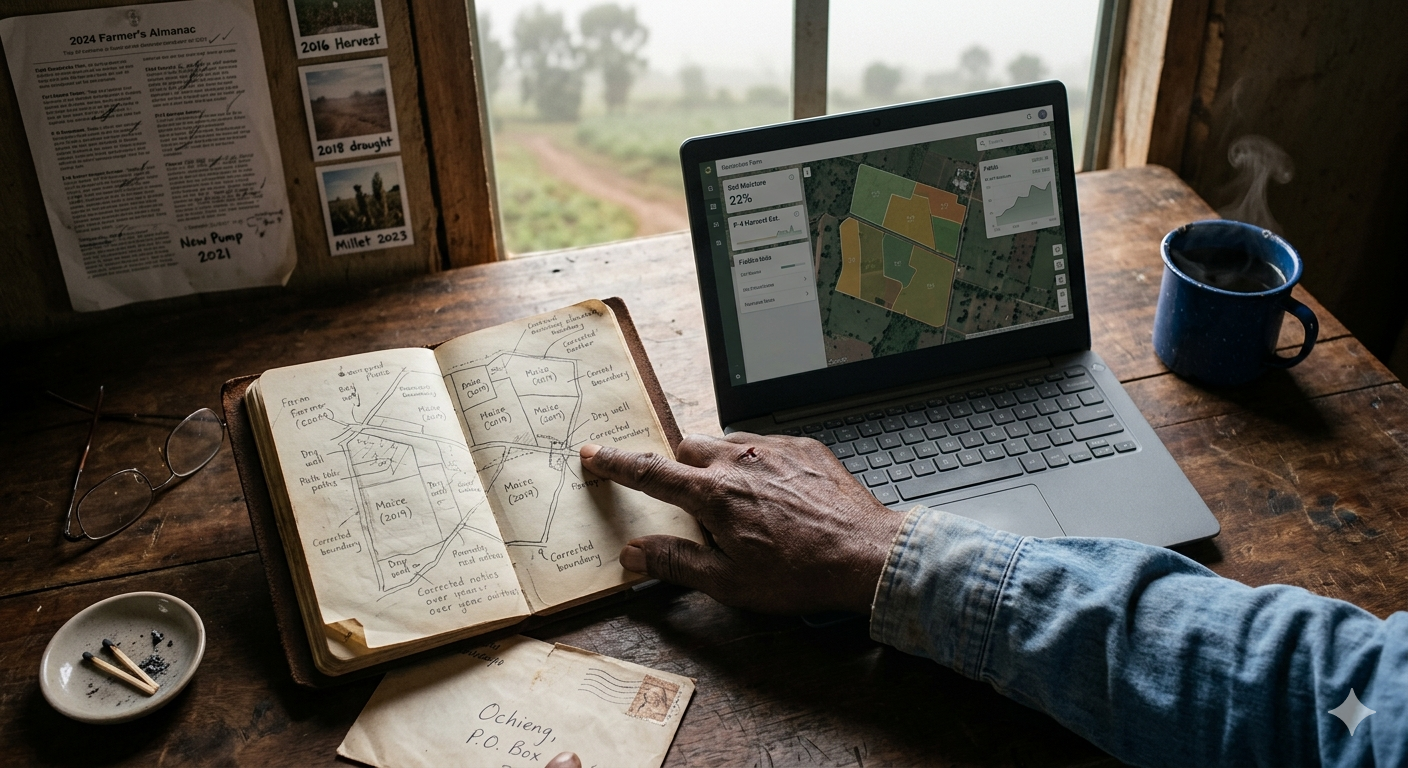
A modern farm is one of the most data-rich places you will find. Tractors and harvesters record their every pass. Satellites watch the fields from above. Sensors read the soil, weather stations track the sky, and trials measure how new inputs perform. Each season, the pile grows. And yet, ask most farmers whether all that information actually answers their questions, and the honest reply is no.
That is the strange truth of farming today. The problem is no longer a shortage of data. It is a flood of it, most of which refuses to work together. Every machine, sensor and app speaks its own language and saves in its own format. What should be one clear picture arrives instead as a heap of files that do not fit, gathered from a dozen systems that were never designed to talk to each other. The result is a farm that is measuring everything and understanding very little.
Fixing that starts with something unglamorous: translation. Before any of the information can be useful, it has to be put into a common form so the pieces connect. Once the soil reading, the satellite image, the machine record and the weather log all line up, a farm can finally ask questions of the whole thing at once, instead of spending hours wrestling with spreadsheets just to line up the basics.
The next gain is speed. Work that once kept an analyst busy for days, sifting and cross-checking, can now be done in minutes. That matters in a business where the right moment to act can pass in an afternoon. But faster computing is not really the breakthrough. The breakthrough is who gets to use it.
For years, drawing answers out of farm data required a specialist, someone fluent in mapping software and database queries. The person who actually understood the field, the farmer or the agronomist, was kept at arm's length from the very information that described their own land. That is starting to change. Instead of learning technical tools, a grower can now ask a plain question. Where is this field falling behind. Where did the machine slow down. Where are the results not adding up. The answer comes back as a map and an explanation, not a wall of code.
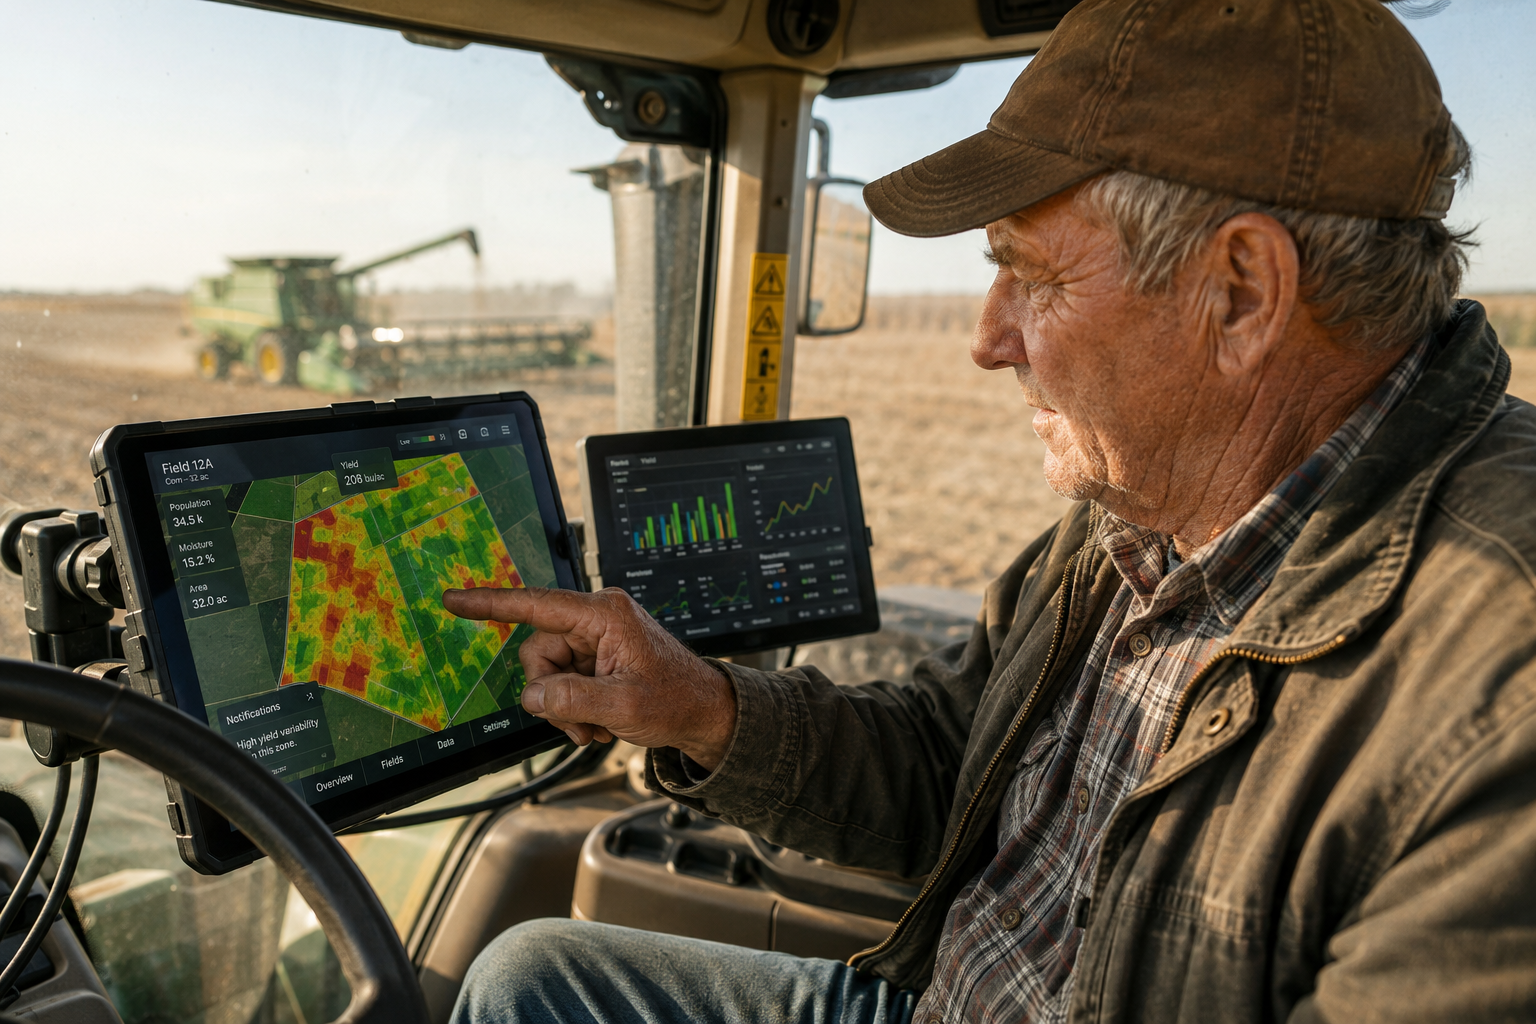
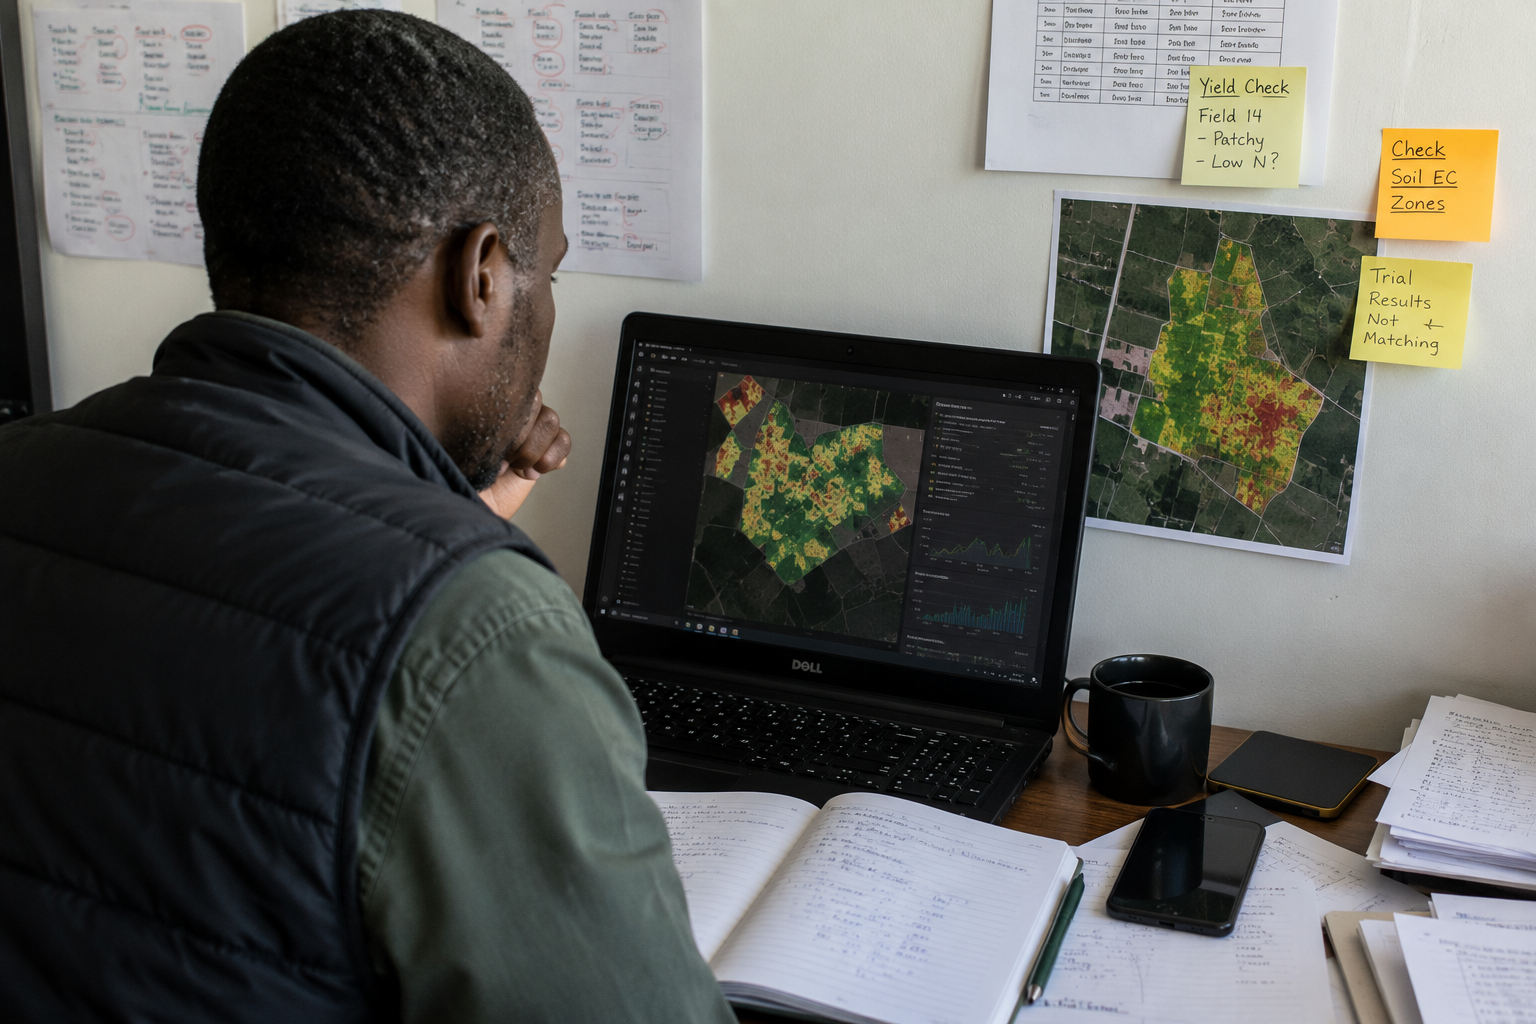
Seeing it laid out on a map is what makes the difference. Patterns that hide inside a table jump out when you can look at the ground itself, shaded by where things are going well and where they are not. And because a map can be shared, a team can mark it up together, check a surprising result with someone standing in the field, and quickly tell the difference between a real problem and a glitch in the data. That last step matters more than it sounds. A lot of bad decisions come from trusting a number that was never right in the first place.
There is one more shift worth naming, because it runs against the grain of how technology usually arrives in farming. For years the answer to every new capability was another dashboard, another login, another screen to check. The more useful direction is the opposite. The goal is not to send farmers somewhere new to hunt for answers. It is to bring the answers to them, inside the tools and routines they already use, at the moment a decision has to be made.
The value was always sitting in the data. What has been missing is a way to make it speak plainly to the people who can act on it. Get that right, and the point of all this information finally comes clear. Not more numbers, but fewer guesses. Not a bigger pile to manage, but a straighter path from what the field is telling you to what you decide to do about it.